- Original Paper
- Published:
Large-scale dynamics of a heterogeneous forest resource are driven jointly by geographically varying growth conditions, tree species composition and stand structure
Annals of Forest Science volume 69, pages 829–844 (2012)
Abstract
• Context
Forest resource projections are required as part of an appropriate framework for sustainable forest management. Suitable large-scale projection models are usually based on national forest inventory (NFI) data. However, sound projections are difficult to make for heterogeneous resources as they vary greatly with respect to the factors that are assumed to drive forest dynamics on a large spatial scale, e.g. geographically varying growth conditions (here represented by NFI regions), tree species composition (here broadleaf-dominated, conifer-dominated and broadleaf-conifer mixed stands) and stand structure (here high forest, coppice forest and high-coppice forest mixture).
• Question and objective
Our question was how does the variance of forest dynamics parameters (i.e. growth, felling and mortality, and recruitment processes) and that of 20-year forest resource projections partition between these factors (NFI region, tree species composition and stand structure), including their interactions. Our objective was to capitalise on the suitability of an existing multi-strata, diameter class matrix model for the purposes of making projections for the highly heterogeneous French forest resource.
• Methods
The model was newly calibrated for the entire territory of metropolitan France based on most recent NFI data, i.e. for years 2006–2008. The forest resource was divided into strata by crossing the factors NFI region, tree species composition and stand structure. The variance partitioning of the parameters and projections was assessed based on a model sensitivity analysis.
• Results
Growth, felling and mortality varied mainly with NFI region and species composition. Recruitment varied mainly with NFI region and stand structure. All three factors caused variations in resource projections, but with unequal intensities. Factor impacts included first order and interaction effects.
• Conclusions
We found, by considering both first order and interaction effects, that NFI region, species composition and stand structure are ecologically relevant factors that jointly drive the dynamics of a heterogeneous forest resource. Their impacts, in our study, varied depending on the forest dynamics process under consideration. Recruitment would appear to have a particularly great impact on resource changes over time.
1 Introduction
Policy makers need forest resource projections and scenario analyses if they are to develop an appropriate framework for sustainable forest management and wood supply. This is particularly true in the face of renewed challenges such as increasing timber and energy wood production to enhance substitution effects, while considering carbon sequestration in situ, as part of climate mitigation strategies (UNECE 2005). Suitable projection models for managed forests are usually based on national forest inventory (NFI) data (Sterba et al. 2000; Kaufmann 2001; Schelhaas et al. 2007), as they must provide a comprehensive view of relevant forest resource characteristics (e.g. standing wood volume, biomass, carbon storage, and wood availability that can potentially be harvested) on a large spatial (e.g. regional or country) scale. Projection models should take account of the geographic division of forested land due to administrative boundaries relevant for forest sector administration and related policies, and differences in forest growth environmental conditions (e.g. climatic conditions). However, on such a scale, forest resources may be highly heterogeneous in terms of growth conditions, tree species composition (here broadleaf-dominated, conifer-dominated and broadleaf-conifer mixed stands) and stand structure (here high forest, coppice-forest and high-coppice forest mixture). Variations in these factors and their interactions may greatly impact forest dynamics. Thus, a fundamental issue is how can large-scale projection models take account of forest resource heterogeneity and thus provide biologically and statistically sound forest resource projections?
Two complementary modelling approaches are used to take account of the factors that drive forest dynamics processes (i.e. the processes of growth, mortality and regeneration). One approach is to partition the forested land under study into homogeneous strata in accordance with the driving factors (e.g. different strata for different levels of the site fertility factor), and then to model forest dynamics processes specifically within each stratum. The other approach is to model the processes more explicitly as functions of the driving factors under consideration (e.g. to model potential growth as a function of site variables; Pretzsch et al. 2002). The stratification approach is particularly appropriate for the development of large-scale projection models based on NFI data for these data are usually acquired through the sampling of a limited number of inventory plots per unit area (Tomppo et al. 2010). As a single inventory plot is not necessarily representative of the forest stand in which it is located (Salas González et al. 1993), data from several inventory plots must be aggregated for sampling error to be acceptable. NFI data are therefore primarily meaningful only at a larger scale than the forest stand. When making projections based on NFI data, it was found that data aggregation before projection resulted in slightly lower projection variance and bias than data aggregation after projection (Salas-González et al. 2001). Hence, NFI data aggregation into homogenous strata will both take account of forest dynamics driving factors and will ensure that forest resource projections are statistically sound. This strategy is implemented in the European Forest Information Scenario model (EFISCEN), where the forested land under study is partitioned into forest types (according to region, owner class, site class and/or tree species), and forest resource characteristics are projected within each forest type (Schelhaas et al. 2007). Solomon et al. (1986) grouped inventory plots on the basis of basal area (prior to and after harvest) and provided projections by tree species within a given forest type (where forest types were defined by species composition: hardwood, softwood and mixedwood stands).
The biological and statistical soundness of projections based on the stratification approach is potentially dependent upon both how the strata are defined (i.e. the choice of stratification factors and their different levels) and the depiction of forest dynamics processes within the strata. The latter aspect has already been studied intensively, especially at relatively small spatial scales, resulting in various phenomenological (dendrometry-based) and functional (ecophysiology-based) approaches to tree and stand growth modelling (Porté and Bartelink 2002; Pretzsch et al. 2008). In contrast, to our knowledge, there is a lack of specific studies on the former aspect, i.e. the impacts of various stratification factors on the variation of forest dynamics processes between strata, including factor interactions and processes of growth, felling and mortality, and recruitment. But, this aspect is crucial if large-scale projection models are to be developed based on NFI data, and is particularly challenging for heterogeneous forest resources.
Published studies do not in general explain how the definition of the strata was evaluated explicitly as regards its impact on forest dynamics. Rather, the definition of the strata appears to rely on expert knowledge, and forest dynamics processes and resource projections are then evaluated for different strata or for the forested area under study as a whole (Solomon et al. 1986; Nabuurs et al. 2000; Thürig and Schelhaas 2006; Schelhaas et al. 2007). The number of strata (i.e. the number of stratification factor level combinations) is usually limited due to statistical constraints (NFI result precision and maximum resolution).
In the study described herein, we also applied forest resource stratification based on expert knowledge, as more sophisticated stratification methods for the purposes of forest dynamics modelling were not available. However, our study is novel in that it evaluates the factors that define the strata of a heterogeneous forest resource in terms of their relevance for forest dynamics modelling and their relevance for an ecological interpretation. For statistical reasons we focussed on a limited number of three fundamental factors that are assumed to drive forest dynamics processes (here represented by model parameters) on a large scale: (1) regional differences in forest growth conditions (here represented by so-called NFI regions), and differences in terms of (2) tree species composition and (3) stand structure. Our question was: how does the variance of forest dynamics parameters, and of forest resource projections, partition between the factors that define forest resource strata, including their interactions?
We studied this question in regard to the forest resource of metropolitan France (later referred to as France or country), which is one of the most heterogeneous among European forests. Forest growth conditions, tree species composition and stand structure vary considerably at the country scale: high productivity variations (e.g. >30% for beech) are reported for some species (Seynave et al. 2005, 2008); both broadleaf-dominated, conifer-dominated and broadleaf-conifer mixed stands are found (64%, 23% and 13% of the country forested area, respectively; MAAPRAT 2011); and stand structures include even-aged and uneven-aged high forest (58% of the country forested area), high-coppice forest mixture (30%) and coppice forest (12%; MAAPRAT 2011). In addition to this large-scale heterogeneity, major sections of the French forest resource show high heterogeneity at the stand scale: almost half (49%) of the country’s forested area is covered by mixed species stands (Morneau et al. 2008), and the stands that show a mixed structure of high forest and coppice forest (30%) can comprise uneven-aged trees (so-called standards of the especially formerly applied coppice-with-standards silvicultural system).
Diameter-class models or individual tree-based models (Sterba et al. 2000) are the most suitable for making projections of a forest resource composed, to a great extent, of heterogeneous stands. In contrast, age-class models are well suited to making projections for resources consisting of homogeneous stands, but the outputs of such models are reported to be less suitable for heterogeneous forests, especially at scales smaller than the country (Thürig and Schelhaas 2006). This is consistent with the use of a diameter distribution approach to project parts of the French forest resource in the framework of European forest resource studies (Nabuurs et al. 2002). Also, several diameter-class matrix models have been developed to project uneven-aged, mixed species stands that cover large geographic ranges in the United States (Solomon et al. 1986; Liang et al. 2005a, b; Liang 2010), broadly confirming the suitability of this kind of model.
For purposes of our study we used a pre-existing multi-strata, diameter-class matrix projection model developed at the French NFI (hereafter F-NFI model) and, with regard to our research question, our objective was to capitalise on the suitability of this model in order to make projections for the highly heterogeneous French forest resource. The model was therefore newly calibrated for the entire territory of metropolitan France based on the most recent NFI data available, i.e. for years 2006–2008. An underlying goal was to present the F-NFI modelling approach that has not hitherto been published in full, and to evaluate the model based on a sensitivity analysis. To our knowledge, this approach to combined multi-strata matrix modelling and sensitivity analysis is quite novel and its results are assumed to be of general interest for the large-scale modelling of forest dynamics.
2 Materials and methods
2.1 Modelling approach
2.1.1 French National Forest Inventory method
The French NFI has been surveying the full diversity of French metropolitan forests since 1958. These surveys include managed and unmanaged stands of public and private ownership but do not cover forest management practices or owner identities. The results provided are valid on a large scale, ranging from individual administrative regions to the entire metropolitan territory (22 administrative regions in all). They are used mainly (1) to develop forest policy, (2) for related national and international reporting (e.g. on sustainable forest management, carbon and biodiversity issues), (3) to draw up forest management guidelines, and (4) to evaluate wood availability. They are also used for research purposes in various fields.
The inventory method, including its development, use, sampling design, estimates and estimation techniques, is described in detail by Robert et al. (2010). Here, we provide an overview, and particular aspects relevant to model calibration are described in more detail. Since November 2004, the NFI has been providing an annual inventory of the entire country forested area using a systematic sampling design based on a 1 km2 grid. The entire grid is inventoried within 10 years, based on two sets of five systematic annual sub-samples. Each annual sub-sample has a square design. Land cover and land use are inventoried by airborne survey based on annual sub-sample grid points. Production forest (95% of the country forested area; MAAPRAT 2011) and other forest types are inventoried each year by terrestrial survey, where production forest is defined as forest available for wood production, i.e. forest where wood exploitation is possible (economic feasibility is not considered) and reconcilable with other possible forest functions. Inventory plots are set up at the grid points to be visited in the field. About 6,000 to 7,000 plots are inventoried each year. Therefore, each inventory plot of an annual sub-sample corresponds to about 2,000 ha forest. The position of the inventory plot is determined at random within a 900 m × 900 m square centred on the grid point.
Inventory plots are temporary and consist of concentric circular sub-plots. Inventory plot data include a stand description (e.g. tree species composition and stand structure based on a crown cover assessment) in a 25-m radius sub-plot, a survey of flora (species present and cover) in a 15- m radius sub-plot, a description of the soil near the plot centre, and dendrometric measurements in ≤15-m radius sub-plots whose radius depends on tree diameter (measured at breast height, in centimetres over bark). Trees ≥7.5 cm diameter, >22.5 cm diameter and >37.5 cm diameter are measured in 6-m radius, 9-m radius and 15-m radius sub-plots, respectively. Dendrometric measurements are made only in trees ≥7.5 cm diameter and include, for instance, tree diameter, total tree height (m), and increment core measurements that provide the cumulated radial increment over the 5-year period prior to the inventory year (cm, under bark). Bark thickness increment (cm / year) is estimated based on bark thickness equations (C. Duprez and F. Morneau 2010, French NFI, unpublished data). The stem volume (m3) of individual living trees is estimated based on volume equations (F. Morneau and J.C. H. 2010, French NFI, unpublished data), where the stem is defined as the bole >7 cm diameter including the stump above ground. The stem volume excludes stem hollows and stem parts that are unsuitable for any use (e.g. due to rot). The number of trees that have disappeared due to felling or mortality over the 5-year period prior to the inventory year is also assessed, based on the decomposition status of tree stumps and dead trees.
Concerning precision, one annual sample is sufficient to provide a general overview at the national scale. Several annual samples may be merged to increase precision at the national scale and provide results at the regional scale. For instance, when based on five annual samples, total stem volume can be estimated with a 95% confidence interval of ±1.5% for the entire country (2,403 ± 36 million m3), ±4.5% to ±16.7% for individual administrative regions, ±1.8% for all broadleaves and ±3.1% for all conifers (IFN 2010).
2.1.2 Stratification of the forest resource
NFI data from inventory plots were aggregated in accordance with the following stratification factors:
-
NFI region: this factor possessed nine levels, numbered 1–9 (Fig. 1). Each of the NFI regions corresponded either to an individual administrative region or to a group of adjacent administrative regions. This geographic partitioning was implemented in the F-NFI model to reflect both administrative boundaries, which are relevant for French forest sector administration and related policies, and boundaries relevant for forest dynamics. Administrative regions were thus grouped together such that NFI regions were delimited roughly according to differences in forest growth conditions (including climate). This grouping together also considered the number of inventory plots in the forested area, which, for statistical reasons, was to be roughly the same for each NFI region.
Fig. 1 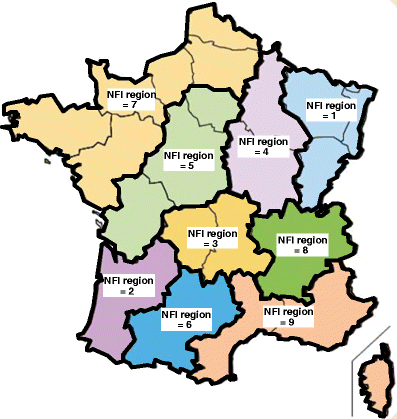
National forest inventory (NFI) regions of metropolitan France delimited in the present study. Each of the nine NFI regions corresponds either to an individual administrative region or to a group of adjacent administrative regions (metropolitan France has 22 administrative regions in all)
-
Tree species composition (three levels): broadleaf-dominated stands (relative crown cover due to broadleaves ≥75%), conifer-dominated stands (relative crown cover due to conifers >75%) and broadleaf-conifer mixed stands (relative crown cover due to broadleaves and conifers ≤75% each). This factor took account of differences in forest dynamics between broadleaves and conifers. This distinction between broadleaves and conifers was also relevant for their specific processing in the French forest sector.
-
Stand structure (three levels): high forest (relative crown cover due to coppice trees <25%), coppice forest (relative crown cover due to coppice trees ≥25% and relative crown cover due to high forest trees <25%) and high-coppice forest mixture (relative crown cover due to coppice and high forest trees ≥25% each). This factor took account of differences in forest dynamics arising from regeneration (slower initial growth from seed in high forest versus faster initial growth from stumps in coppice forest) and competition (e.g. conditions of greater crown competition for canopy trees in high forest compared to canopy trees in high-coppice forest mixture).

This stratification resulted in a maximum of 81 strata (if all exist in reality). A higher level of detail was out of reach for statistical reasons: the number of strata was limited by the number of inventory plots available per stratum (see section on Calibration), and each stratum had to contain sufficient trees to be sub-dividable into different diameter classes. Some of these strata could have been further sub-divided, but this would not have been an appropriate solution as the stratification had to be consistent over the entire country territory. Moreover, as the very interest of our study lay in its large scale, we did not focus on the local scale.
2.1.3 Forest dynamics
Forest dynamics in each stratum were represented by a Markov transition matrix model with constant recruitment, as developed and implemented at the French NFI. The model is deterministic and simulates the time-course of the stratum’s tree diameter distribution y s,t given by the column vector
where n s,i,t = number of trees in stratum s in diameter class i at time t, and i = 1, …, k. During each time step [t, t + 1], the trees occurring at the beginning of the time step in a given diameter class either stay in the same diameter class, move up one diameter class (growth), or disappear due to felling or natural mortality (undifferentiated). New trees are recruited in the first diameter class. The model equation corresponds to
where G s is the transition matrix
and r s is the recruitment vector
where g s,i = growth parameter giving the proportion of the trees in diameter class i < k that survive and move up to diameter class i + 1 during each time step; fm s,i = felling + mortality parameter giving the proportion of the trees in diameter class i that disappear during each time step; and r s,1 = recruitment parameter giving the number of new trees growing into the first diameter class (i = 1) during each time step. Parameter values are specific to each stratum (s) and diameter class (i). Parameters g s,i, fm s,i, r s,1 are referred to herein as forest dynamics parameters.
The projected number of trees per stratum diameter class (n s,i,t) can be used to calculate further output variables per stratum diameter class such as total stem volume, total tree biomass, and carbon content. In this study we calculated total stem volume v s,i,t using
where \( \overline {{v_{{s,i}}}} \) = mean individual stem volume of a tree in diameter class i in stratum s.
2.1.4 Hypotheses
This model relies on the following hypotheses:
-
(H1) time-course changes in tree diameter distributions (y s,t) are independent one from the other in the different strata. Also, matrix projection models assume implicitly that trees behave independently;
-
(H2) forest area, site conditions and inter-tree competition are stationary within each stratum. In other words, forest dynamics parameters per stratum diameter class (g s,i, fm s,i, r s,1) are assumed to be constant over time (stationary hypothesis; Vanclay 1994), and only resource stratification factors have an impact on forest dynamics and on the resulting resource projections. This ensured that the results we obtained for our research question were not influenced by factors other than the stratification factors under consideration;
-
(H3) the state of a tree at time t + 1 depends only on its state at time t, i.e. it does not depend on any previous state (Markov hypothesis; Vanclay 1994);
-
(H4) no tree can regress towards a lower diameter class or grow more than one diameter class during a time step (Usher hypothesis; Vanclay 1994). In order to preclude excessive upgrowth, diameter classes must be sufficiently wide, and the time step sufficiently short.
2.1.5 Calibration
Forest resource strata and forest dynamics parameter values provided a snapshot of the entire forest resource. They were determined using NFI data for years 2006, 2007 and 2008. The data used corresponded to almost the entire country production forest, and included groves of tree cover ≥40%. They excluded poplar plantations, temporarily deforested areas, stands whose structure could not be determined, and stands whose crown cover due to trees ≥7.5 cm diameter was ≤15%. These exclusions corresponded to 10% (1,899 inventory plots) of all 19,684 inventory plots surveyed in 2006–2008. The remaining 17,785 inventory plots did not include all the 81 theoretically possible combinations of stratification factor levels as NFI region 1 did not contain any mixed broadleaf-conifer coppice forest, and NFI regions 1–8 did not contain any conifer coppice forest. We were left with 72 combinations, i.e. 72 strata. Finally, we used 63 strata based on 17,765 inventory plots for forest dynamics modelling (Table 1) after removing all mixed broadleaf-conifer and conifer coppice forests as covered by too few inventory plots (1% of inventory plots in coppice forest and 0.1% of all 17,785 inventory plots). Had they been retained they would have caused great uncertainty in model calibration, and they are of little importance in the forest management of the current forest resource and its likely medium-term development.
Hypothesis H4 was satisfied by using a 1-year time step and diameter classes of 10 cm in width since a tree would have to grow unrealistically rapidly (more than 10 cm in diameter per year) to move up more than one diameter class in the course of one time-step. Relatively large diameter classes were chosen both to limit the number of parameters (parsimony principle), and to allow for sufficient precision in forest dynamics parameter values, and hence in projections since in some strata relatively few trees were available per diameter class for determining parameter values. In turn, the use of relatively large diameter classes potentially resulted in poor accuracy, i.e. resulted in projection bias as a given parameter value was based on an average value derived from trees of various sizes. Given this trade-off between precision and accuracy, we considered the risk of introducing bias less important as long as the potential bias followed a uniform trend (i.e. either overestimation or underestimation), and given that we analysed the relative impact of stratification factors. We ensured that potential bias was uniform by using the same diameter class width and time step length for all strata. Moreover, in order to compare forest dynamics parameter values for a given diameter class between strata (see Global sensitivity analysis), the diameter class width had to be the same for all strata.
Only the highest diameter class did not have constant width, i.e. no upper limit. The lower limit of the first diameter class (i = 1 in Eq. 1) was 7.5 cm, corresponding to the threshold diameter in the dendrometric inventory (see French National Forest Inventory method). We established a total of 14 diameter classes as an overall maximum for all strata, i.e. the lower limit of the highest possible diameter class was 137.5 cm. A given stratum could nevertheless contain fewer than 14 diameter classes. We chose the highest diameter class for which trees were inventoried in 2006–2008 as the highest diameter class (i = k with k ≤ 14) in the stratum matrix model.
Forest dynamics parameter values were determined specifically for each stratum diameter class based on the relevant NFI data (Table 2; Eqs. 6–11 in Appendix 1). Growth parameter values (g s,i in 1 / year, Eq. 3) were based on increment core measurements. These measurements included trees that had recently passed the 22.5 cm- and 37.5 cm-diameter thresholds in the 9 m- and 15 m-radius sub-plots, respectively. This ingrowth was not modelled explicitly as the model projected the number of trees per stratum diameter class (n s,i,t, Eq. 1), not the number of trees per sub-plot and diameter class. In other words, the 22.5 cm- and 37.5 cm-diameter thresholds were removed by calculating the number of trees per stratum based on the data inventoried in the sub-plots. Felling + mortality parameter values (fm s,i in 1 / year, Eq. 3) were based on assessments of tree stump and dead tree decomposition status. Uncertainty in this assessment was high, and expert knowledge suggested that felling + mortality parameter values were clearly underestimated. Thus, all felling + mortality parameter values were multiplied by a global correction factor. This was determined on the basis of expert knowledge and was tuned to meet approximately the total stem volume that disappeared in 2007 on the country scale—as specified by other data sources (FAO 2010; MAAPRAT 2011). Model calibration for recruitment (r s,1 in number of trees / year, Eq. 4) was based on increment core measurements. The mean annual number of trees that passed the lower limit of the first diameter class was determined by calculating tree diameters 5 years prior to inventory. Recruitment into higher diameter classes than the first diameter class was not modelled as it occurred very rarely in the NFI data used. Only about 0.1% of the trees recruited over the 5-year period prior to the inventory year were located in the second diameter class [17.5, 27.5[ cm, and none was located in higher diameter classes. Mean individual stem volume (\( \overline {{v_{{s,i}}}} \) in m3, Eq. 5) was calculated specifically for each stratum diameter class from NFI volume estimates (F. Morneau and J.C.H. 2010, French NFI, unpublished data).
2.2 Sensitivity analysis
The impact of resource stratification factors on forest dynamics processes and resource projections was measured using global and local methods in the sensitivity analysis. As a definition, global methods assess the impact of an input factor when all the other input factors are varying. By contrast, local methods assess the impact of the variation in one single input factor while the other input factors are set to their default values (Cariboni et al. 2007).
2.2.1 Representation of forest dynamics processes and resource projections
Forest dynamics processes were represented by model parameters for growth, felling + mortality and recruitment. Resource projections were studied over a 20-year period based on the following model output variables: total number of trees / ha (Nha), total stem volume (m3 /ha) (Vha), and tree diameter distribution.
2.2.2 Global sensitivity analysis
A global sensitivity analysis method (Saltelli et al. 2004; Wernsdörfer et al. 2008) was used to assess—separately per diameter class—the relative impacts of stratification factors on forest dynamics parameters and model output variables. For any given parameter (or output variable) within a given diameter class, its total variance due to all stratification factors and their different levels was decomposed into the variance parts due to each of the stratification factors, and their interactions. Thus, sensitivity measurements were calculated for the relative impact of one, two or three stratification factors on the parameter (or output variable), i.e. first, second or third order effects (Eqs. 12–17 in Appendix 2). The higher the value of a sensitivity measurement, the greater the impact. The sum of the sensitivity measurement values for all orders was equal to one.
Data providing all possible combinations of stratification factor levels were necessary to calculate the sensitivity measurements (fully-crossed factorial design). As this was not the case for coppice forest, this level of stand structure was excluded from the analysis. Hence, the factorial design included 9 levels of NFI region (NFI region = 1–9), 3 levels of species composition (broadleaf-dominated stand, broadleaf-conifer mixed stand and conifer-dominated stand) and 2 levels of stand structure (high forest and high-coppice forest mixture), resulting in 54 combinations, i.e. in 54 strata. The total variance of a given parameter (or output variable) within a given diameter class, was calculated as its empirical variance across these 54 strata. Moreover, all 54 strata were represented only in the lower diameter classes up to the [37.5, 47.5[-cm diameter class; 53 and 51 strata were represented in the [47.5, 57.5[-cm and [57.5, 67.5[-cm diameter classes, respectively; and <50 strata were represented in the higher diameter classes. Sensitivity measurements were thus calculated for the [7.5, 17.5[ cm diameter classes up to [57.5, 67.5[ cm, bearing in mind that the results for the [47.5, 57.5[-cm and [57.5, 67.5[-cm diameter classes were less reliable (no fully-crossed factorial design).
2.2.3 Local sensitivity analysis
All the 63 stratification factor level combinations were considered in an additional local sensitivity analysis. The projected time-course changes in Nha and Vha, and in tree diameter distribution, were plotted for the different levels of a given stratification factor, while the output variable and diameter distribution values for the levels of the other stratification factors were aggregated, i.e. summed up. Nha-values (or Vha-values) for several strata were aggregated by summing up the total number of trees per stratum (or the total stem volume per stratum) and by dividing this by the sum of the strata areas. The values were aggregated based on projected values, i.e. after projection.
2.2.4 Simulations
The stratum tree diameter distributions used as starting points for the simulation runs were calculated as means from the corresponding NFI data for years 2006–2008. Simulation starting year was set to 2007 and we chose the relatively short projection period of 20 years to reduce violations of the stationary hypothesis (H2).
3 Results
3.1 Global sensitivity analysis
3.1.1 Growth
Growth was impacted mainly by NFI region and species composition, while stand structure had virtually no impact on this forest dynamics process (first order effects, Fig. 2). A comparison of stratification factor impacts on growth between diameter classes showed that NFI region had slightly lower impacts in the low diameter classes [7.5, 17.5[ cm and [17.5, 27.5[ cm, and species composition had lower impacts in the high diameter classes [47.5, 57.5[ cm and [57.5, 67.5[ cm. Overall, second and third order interaction effects on growth were lower than first order effects, except in the high diameter classes. Considerable interaction effects always involved NFI region, and the greatest interaction effects were found for NFI region and species composition (second order effect), and for the high diameter classes.

Sensitivity of model growth, felling + mortality and recruitment parameters, and sensitivity of the total number of trees / ha (Nha) model output variable to stratification factors NFI region, tree species composition and stand structure, and their interactions. NFI region had 9 levels (NFI region = 1–9, Fig. 1), species composition had 3 levels (broadleaf-dominated, conifer-dominated and broadleaf-conifer mixed stands) and stand structure had 2 levels (high forest and high-coppice forest mixture). Sensitivity measurements for the parameters are given by tree diameter (at breast height, over bark) class. Diameter classes are indicated by their lower limit, starting from the 7.5 cm-limit, and each has a width of 10 cm. Sensitivity measurements for growth and felling + mortality parameters in diameter classes [47.5, 57.5[ cm and [57.5, 67.5[ cm were less reliable as not all combinations of stratification factor levels were available for calculation. Sensitivity measurements for diameter classes ≥67.5 cm are not given. Recruitment occurred only in the first diameter class (lower limit = 7.5 cm). Sensitivity measurements for Nha are given every 5 years from 2007 (NFI data) to year 2027 (20-year projection). (1) stands for no unit
3.1.2 Felling + mortality
Overall, the pattern of stratification factor impacts on felling + mortality was similar to that observed for growth, with NFI region and species composition having the highest impacts regarding first order and interaction effects (Fig. 2). But, in contrast to growth, interaction effects on felling + mortality involving NFI region and species composition were slightly higher than first order effects. Moreover, for felling + mortality, stratification factor impacts did not show a clear trend from the [7.5, 17.5[-cm diameter class up to the [57.5, 67.5[-cm diameter class.
3.1.3 Recruitment
In contrast to growth and felling + mortality, species composition had only a minor impact on recruitment (Fig. 2). NFI region and stand structure had clear and similar impacts (first order effects). Second order interaction effects involving NFI region were similar to first order effects, while the second order effect of stand structure and species composition was markedly lower.
3.1.4 Projected total number of trees / ha
The Nha output variable was impacted by all stratification factors (first order effects, Fig. 2), with stand structure having clearly the highest impact and species composition clearly the lowest impact (first order effects). Moreover, the first order effects failed to show any clear trend over time except for a slight increase in stand structure impact from 2007 to 2012. The highest second order interaction effect on Nha was noted for species composition and stand structure, and this impact decreased over time (from 2007 until 2027).
3.2 Local sensitivity analysis
In the local sensitivity analysis, the impact of each stratification factor on model outputs was analysed separately, including output changes over time (Fig. 3). Overall, Nha decreased over time (from 2007 until 2027), while Vha increased. The number of trees per diameter class clearly decreased over time in the [7.5, 17.5[-cm diameter class, and increased in the ≥27.5 cm diameter classes. The inflexion between the two tendencies occurred in the [17.5, 27.5[-cm diameter class.

Change over time from year 2007 (NFI data) to year 2027 (20-year projection) in model output variables total number of trees / ha (Nha) and total stem volume / ha (Vha), and in tree diameter (at breast height, over bark) distribution. Model outputs are plotted for the different levels of a given stratification factor, while the other stratification factor levels were aggregated after projection: 9 levels of NFI region (NFI region = 1–9; top row), 3 levels of tree species composition (broadleaf-dominated, conifer-dominated and broadleaf-conifer mixed stands; middle row) and 3 levels of stand structure (high forest, coppice forest and high-coppice forest mixture; bottom row). Diameter classes are indicated by their lower limit starting from the 7.5 cm-limit, and each has a width of 10 cm. Diameter classes ≥67.5 cm are not plotted as the number of trees per diameter class was relatively low and thus barely visible on the chart
3.2.1 NFI region
Values for Nha were highest in the southeast of the country (NFI region = 9, Figs. 1 and 3) and lowest in the southwest (NFI region = 2). The highest and lowest Vha values were found in the centre of the country (NFI region = 3) and in the southeast (NFI region = 9), respectively. The slopes of the decrease in Nha, and of the increase in Vha, differed between NFI regions.
3.2.2 Species composition
Values for Nha were highest in broadleaf-dominated stands and lowest in conifer-dominated stands (Fig. 3). Decreases in Nha over time were roughly similar in conifer-dominated and broadleaf-conifer mixed stands, but slower in broadleaf-dominated stands. Values for Vha were highest in conifer-dominated stands and increased rapidly. Vha increased slightly more slowly in broadleaf-dominated stands, and very slowly in mixed stands. The lowest Vha values were therefore found in broadleaf-dominated stands over about the first half of the simulation period (from 2007 until about 2017), and in broadleaf-conifer mixed stands thereafter (from about 2017 until 2027).
3.2.3 Stand structure
Values for Nha were highest in coppice forest and lowest in high forest. The opposite was true for Vha. The values for these two output variables in high-coppice forest mixture corresponded to roughly the average values seen in high forest and coppice forest, and time-course changes differed little between levels of stand structure.
4 Discussion
We will first discuss to what extent the F-NFI modelling approach was an appropriate means to answer our research question. We will then discuss our results and the answers provided.
4.1 Modelling approach
4.1.1 Data-model interactions
The modelling approach presented was suitable for model calibration using French NFI data, but some issues arose related to data-model interactions. Little longitudinal data were available as the inventory plots are only temporary. This was in accordance with the Markov hypothesis (H3), meaning that a tree’s history is not required to project its transition between diameter classes (Vanclay 1994). And, Picard et al. (2003) showed (in the case of natural tropical rainforest) that the Markov hypothesis is robust when it comes to model projections. The longitudinal NFI data available for 5-year radial increment were used to calibrate growth and recruitment parameters. However, given that we found felling + mortality parameter values to be underestimated, a correction factor had to be introduced, and this calls for an improvement in the quality on NFI felling + mortality data, for instance by surveying the same inventory plots 5 years after the first visit, as recently implemented by the French NFI. Moreover, zero values for felling + mortality parameters in the highest stratum diameter class (fm s,k = 0; Table 2) may result in unrealistic long-term projections for matrix models with constant recruitment always converge towards a steady state. In the F-NFI model, the steady state y s,∞ can be obtained by solving y s,∞ = G s y s,∞ + r s or, y s,∞ = (I − G s)−1 r s, where I is the k × k identity matrix. In the highest diameter class, this results in \( {n_{{s,k,\infty }}} = {g_{{s,k - 1}}}{n_{{s,k - 1,\infty }}} + (1 - f{m_{{s,k}}}){n_{{s,k,\infty }}} \). If fm s,k = 0 then n s,k,∞ = ∞, i.e. the highest diameter class will indefinitely accumulate trees, and Vha will increase. Also, for any given diameter class, fm s,i-values were set to fm s,i = 0 if no tree was inventoried in that class (Appendix 1). This problem could be solved in various ways: (1) by merging the highest diameter classes; (2) by interpolating fm s,i-values from neighbouring classes; (3) by using y s,∞ = G s y s,∞ + r s or y s,∞ = (I − G s)−1 r s to compute fm s,i-values from g s,i-values and an estimate of the stationary diameter distribution y s,∞ (Ingram and Buongiorno 1996). Finally, methods such as logistic regression and zero inflated models may be tested in the modelling of felling, mortality and recruitment processes, especially when these processes are modelled as functions of environmental factors and competition (see Modelling needs for long-term projections).
4.1.2 Diameter classes
Also, projection precision and accuracy may be optimised by choosing the appropriate diameter class width and time step length, under the constraint of the Usher hypothesis (H4). Diameter class width in the F-NFI model was based on an expert’s choice, employing a trade-off between precision and accuracy (see Calibration). A more sophisticated solution would be to apply the method developed by Picard et al. (2010b), which optimises the choice of class width by minimising the sum of the distribution error and the sample error. Moreover, class width cannot be chosen independently of time step length (Picard et al. 2010b).
4.1.3 Modelling needs for long-term projections
In our study, the stationary hypothesis (H2) restricted the length of the projection period considered to be reasonable. Forest dynamics parameter values were based on NFI data available for three consecutive years (2006–2008) and were assumed to depict growth trends correctly immediately following these years but not necessarily in longer-term growth trends. For instance, major productivity fluctuations for beech in north-eastern France (increases of up to 28% and decreases of 5% over 27 years) were associated with the medium-term trend (22.5% increase over 27 years; Charru et al. 2010). In the longer term (several decades to one century), reported changes in productivity often exceed 50% in France (Dhôte and Hervé 2000; Bontemps et al. 2011) and underline global change effects. This calls for more explicit modelling of forest dynamics processes as functions of environmental factors, i.e. for some relaxing of the stationary hypothesis. Moreover, were changes in competition to be taken into account, this would allow for the simulation of felling scenarios. The stationary hypothesis has already been partly relaxed by the development of matrix growth models at the stand scale that take account of site variables and stand density (competition) covering various conditions over a large scale (Liang 2010). However, for large-scale projection models on the resource stratum scale where French NFI data are primarily meaningful (see Introduction), the question arises as to how can competition be modelled within a stratum composed of many stands and trees in different states of development (e.g. the stratum of broadleaved high-coppice forest mixture stands in a given NFI region). However, changes in stand density were found to have a negligible impact on relatively short model projection periods of about 15 years (Lin and Buongiorno 1997). In this respect, the 20-year projection period chosen in our study may be considered as reasonable.
4.2 Forest resource stratification
The F-NFI model should be improved and further developed in order to address the issues discussed above. However, concerning the relative impacts of stratification factors, it was noted that projection accuracy was less important here as long as the potential bias followed a uniform trend (see Calibration).
4.2.1 Relevance for modelling of forest dynamics
The sensitivity analysis showed that none of the stratification factors could be left out in attempts to simplify the model as all had considerable impacts on at least some forest dynamics processes or model output variables (Figs. 2, 3). However, we cannot be sure that the stratification factors chosen, and their different levels, were optimal for the statistical soundness of model projections as these were based solely on expert knowledge. Facing a similar problem, Picard et al. (2010a) proposed a method used to group together the species employed for forest dynamics modelling (in the case of natural tropical rainforest), where groupings were sought that minimised the quadratic error of model predictions. Were such a method to be developed for the purposes of determining the most suitable resource stratification, this would contribute to improving the F-NFI model and could take as a starting point the newly-developed biophysical classification of country forested land, i.e. the so-called silvo-eco-regions (Cavaignac 2009).
The results yielded by the global sensitivity analysis for Nha suggested that recruitment was particularly important for model projections (Fig. 2). Nha values were derived from forest dynamics driven by the different growth, felling + mortality and recruitment processes. As forest dynamics processes had different sensitivity patterns, a compensation effect was very likely in evidence here, such that the Nha pattern was less contrasted than the process patterns. Of the three processes, only recruitment was considerably impacted by stand structure, and stand structure had the greatest impact on Nha. In addition, this impact of stand structure increased slightly over time. Only recruitment was barely impacted by species composition, and species composition had the lowest impact on Nha. The suggested high impact of recruitment on resource projections is also supported by the results of the EFISCEN sensitivity analysis (Schelhaas et al. 2007), where regeneration in the first age-class was controlled by the so-called young forest coefficient. These results could be confirmed by an additional sensitivity analysis on the impact of forest dynamics processes on resource projections.
4.2.2 Ecological relevance
The sensitivity of forest dynamics processes to resource stratification factors is ecologically relevant. The marked NFI region effect on growth (Fig. 2) may reflect mainly differences in climate. Seynave et al. (2005, 2008) found climate to be the most important predictor of potential growth on a large scale. Also, it may reflect possible genetic differentiation between regional tree populations or regional differences in forest management practices (not surveyed by the French NFI). In contrast, the stratification by NFI region barely reflected factors such as trophic factors, which vary more locally, as forest dynamics parameters were calculated as means per stratum diameter class. This limitation could be overcome by modelling forest dynamics processes more explicitly as functions of environmental factors (see Modelling needs for long-term projections). The NFI region effect on growth was similar to the effect induced by differences in growth between broadleaves and conifers (species composition; Figs. 2, 3). Overall, mortality is usually low in managed forests and felling is the main reason why trees disappear. More productive forests allow for higher felling levels. This may explain the similar sensitivity patterns we noted for growth and felling + mortality, with NFI region and species composition being the most important factors. In contrast, species composition had almost no impact on recruitment. Both broadleaves and conifers include species that cover a large range of ecological profiles (e.g. in terms of light demand and shade tolerance). Hence, differences between the ecological profiles of species and their impact on regeneration and recruitment may not be detected by distinguishing broadleaf- and conifer-dominated stands. This limitation may be overcome by distinguishing between species with contrasted ecological profiles or distinguishing between species groups when modelling forest dynamics processes as functions of environmental factors or competition (Modelling needs for long-term projections).
We noted that recruitment varied between high forest and high-coppice forest mixture (coppice forest was excluded from the global sensitivity analysis; see Global sensitivity analysis). This effect of stand structure on recruitment depended on the NFI region (second order effect). An explanation for this may be that the different stand structures are unevenly distributed over the country. The highest proportion (percentage of forest area) of high forest stands is reported in the north, north-east and south-west of the country. In contrast, the highest proportion of high-coppice forest mixture stands is reported in the centre, west and south of the country (MAAPRAT 2011). Also, a second order interaction effect of NFI region and species composition was noted for all three forest dynamics processes and may be explained by the uneven distribution over the country of broadleaf-dominated and conifer-dominated stands. Broadleaf-dominated stands prevail especially in the northern part of the country and in the south, while conifer-dominated and broadleaf-conifer mixed stands prevail in the southwest and centre-southeast, with the latter including mountainous areas (IFN 2010). A further explanation may be that the same species show different dynamics under different growth conditions (NFI regions), or that broadleaf-dominated stands comprise different broadleaf species in different regions (as do conifer-dominated stands).
4.2.3 Forest resource and steady state
No attempt was made here to compute the long-term steady state of the French forest resource as zero values for felling + mortality parameters could have resulted in unrealistic long-term projections (see Data-model interactions). However, the results of the local sensitivity analysis did show that the current forest resource does not correspond to a steady state. Nha decreased over time and Vha increased for all stratification factors. These tendencies stemmed from a shift in the projected number of trees from the lower to the higher diameter classes between 2007 and 2027 (Fig. 3). The shift is plausible since 2007 had a surplus of trees in the lower diameter classes, related to an increase in forest area (i.e. of young stands) in the past (12% increase from 1985 to 2005; IFN 2007). In the projections starting in 2007, forest area was assumed to be constant over time (hypothesis H2). Consequently, recruitment in the first diameter class did not completely compensate for the number of trees growing into the higher diameter classes. Additionally, the increase in Vha may have resulted from tree accumulation in the highest stratum diameter classes due to zero values for felling + mortality parameters (Data-model interactions). The rapidity of the time-course change in the tree diameter distribution, and the related increase in Vha (Fig. 3), should be subjected to further analyses. More explicitly modelling of the impact of environmental factors and competition on forest dynamics processes would both improve our understanding of these processes on a large scale and reduce uncertainty in model projections (see Modelling needs for long-term projections). Moreover, analysing long-term projections may improve our understanding of the model’s behaviour, and comparisons of these projections with current knowledge and hypotheses on long-term forest dynamics could serve to evaluate the model’s biological soundness.
5 Conclusions and perspectives
-
Forest resource stratification combined with a diameter-class matrix model of forest dynamics provided biologically meaningful projections of a heterogeneous forest resource.
-
We found NFI region, tree species composition and stand structure to be jointly driving ecologically relevant factors in the dynamics of a heterogeneous forest resource. None of the factors could be excluded when attempts were made to simplify the F-NFI model. Future work should aim to develop more sophisticated stratification methods that take account of the statistical properties (precision, accuracy) of model projections.
-
Our results suggest that recruitment processes have a particularly marked impact on forest resource projections. Further analyses should focus on the impact of the different forest dynamics processes on resource projections, and the related improvement of model calibration which should include a choice of tree diameter classes (width, number) and time step length.
-
The stationary hypothesis was well suited to the study of our research question based on currently observed forest dynamics and medium-term (20-year) resource projections. If it is to consider scenario analyses and longer term projections, then model development should in particular focus on two aspects:
-
(1) The modelling of forest dynamics processes as functions of competition, thus allowing for the simulation of different felling scenarios. This raises the issue of suitable dendrometric concepts for modelling competition within forest resource strata on a large scale.
-
(2) More explicit modelling of forest dynamics processes as functions of environmental factors (that so far have implicitly been taken into account through resource stratification), particularly those factors that are liable to undergo major changes over time in a context of global change.
References
Bontemps JD, Hervé JC, Leban JM, Dhôte JF (2011) Nitrogen footprint in a long-term observation of forest growth over the twentieth century. Trees 25:237–251
Cariboni J, Gatelli D, Liska R, Saltelli A (2007) The role of sensitivity analysis in ecological modelling. Ecol Model 203:167–182
Cavaignac S (2009) Les sylvoécorégions (SER) de France métropolitaine, Etude de définition. Report, French National Forest Inventory, Nogent-sur-Vernisson
Charru M, Seynave I, Morneau F, Bontemps JD (2010) Recent changes in forest productivity: an analysis of national forest inventory data for common beech (Fagus sylvatica L.) in north-eastern France. For Ecol Manag 260:864–874
Dhôte JF, Hervé JC (2000) Changements de productivité dans quatre forêts de chênes sessiles depuis 1930: une approche au niveau du peuplement. Ann For Sci 57:651–680
FAO, Food and Agriculture Organisation of the United Nations (2010) Global forest resource assessment 2010, country report, France. FAO Forest Department, Rome
IFN, Inventaire Forestier National (2007) La forêt française - les résultats issus des campagnes d’inventaire 2005 et 2006. Report, French National Forest Inventory, Nogent-sur-Vernisson
IFN, Inventaire Forestier National (2010) La forêt française, Les résultats issus des campagnes d'inventaire 2005 à 2009, Les résultats pour la France. Report, French National Forest Inventory, Nogent-sur-Vernisson
Ingram CD, Buongiorno J (1996) Income and diversity tradeoffs from management of mixed lowland dipterocarps in Malaysia. J Trop For Sci 9:242–270
Kaufmann E (2001) Estimation of standing timber, growth and cut. In: Brassel P, Lischke H (eds) Swiss national forest inventory: methods and models of the second assessment. WSL Swiss Federal Research Institute, Birmensdorf, pp 162–196
Liang J (2010) Dynamics and management of Alaska boreal forest: an all-aged multi-species matrix growth model. For Ecol Manag 260:491–501
Liang J, Buongiorno J, Monserud RA (2005a) Growth and yield of all-aged Douglas fir–western hemlock forest stands: a matrix model with stand diversity effects. Can J For Res 35:2368–2381
Liang J, Buongiorno J, Monserud RA (2005b) Estimation and application of a growth and yield model for uneven-aged mixed conifer stands in California. Int For Rev 7:101–112
Lin CR, Buongiorno J (1997) Fixed versus variable-parameter matrix models of forest growth: the case of maple-birch forests. Ecol Model 99:263–274
MAAPRAT, Ministère de l’Agriculture, de l’Alimentation, de la Pêche, de la Ruralité et de l’Aménagement du Territoire (2011) Indicateurs de gestion durable des forêts françaises métropolitaines, Edition 2010. Report, French National Ministry of Agriculture, Nutrition, Fishery, Rural Area and Land-use Planning, Paris
Morneau F, Duprez C, Hervé JC (2008) Les forêts mélangées en France métropolitaine. Caractérisation à partir des résultats de l’Inventaire Forestier National. Rev For Fr 60:107–120
Nabuurs GJ, Schelhaas MJ, Pussinen A (2000) Validation of the European Forest Information Scenario Model (EFISCEN) and a projection of Finnish forests. Silva Fenn 34:167–179
Nabuurs GJ, Pussinen A, Karjalainen T, Erhard M, Kramer K (2002) Stemwood volume increment changes in European forests due to climate change—a simulation study with the EFISCEN model. Glob Chang Biol 8:304–316
Picard N, Bar-Hen A, Guédon Y (2003) Modelling diameter class distribution with a second-order matrix model. For Ecol Manag 180:389–400
Picard N, Mortier F, Rossi V, Gourlet-Fleury S (2010a) Clustering species using a model of population dynamics and aggregation theory. Ecol Model 221:152–160
Picard N, Ouédraogo D, Bar-Hen A (2010b) Choosing classes for size projection matrix models. Ecol Model 221:2270–2279
Porté A, Bartelink HH (2002) Modelling mixed forest growth: a review of models for forest management. Ecol Model 150:141–188
Pretzsch H, Biber P, Dursky J (2002) The single tree-based stand simulator SILVA: construction, application and evaluation. For Ecol Manag 162:3–21
Pretzsch H, Grote R, Reineking B, Rötzer T, Seifert S (2008) Models for forest ecosystem management: a European perspective. Ann Bot 101:1065–1087
Robert N, Vidal C, Colin A, Hervé JC, Hamza N, Cluzeau C (2010) France. In: Tomppo E, Gschwantner T, Lawrence M, McRoberts RE (eds) National forest inventories—pathways for common reporting. Springer, Heidelberg, pp 207–221
Salas González R, Houllier F, Lemoine B, Pierrat JC (1993) Représentativité locale des placettes d’inventaire en vue de l’estimation de variables dendrométriques de peuplement. Ann For Sci 50:469–485
Salas-González R, Houllier F, Lemoine B, Pignard G (2001) Forecasting wood resources on the basis of national forest inventory data. Application to Pinus pinaster Ait. in southwestern France. Ann For Sci 58:785–802
Saltelli A, Tarantola S, Campolongo F, Ratto M (2004) Sensitivity analysis in practice. Wiley, Chichester
Schelhaas MJ, Eggers J, Lindner M, Nabuurs GJ, Pussinen A, Päivinen R, Schuck A, Verkerk PJ, van der Werf DC, Zudin S (2007) Model documentation for the European forest information scenario model (EFISCEN 3.1.3). Report, ALTERRA / EFI, Wageningen
Seynave I, Gégout JC, Hervé JC, Dhôte JF, Drapier J, Bruno E, Dumé G (2005) Picea abies site index prediction by environmental factors and understorey vegetation: a two-scale approach based on survey databases. Can J For Res 35:1669–1678
Seynave I, Gégout JC, Hervé JC, Dhôte JF (2008) Is the spatial distribution of European beech (Fagus sylvatica L.) limited by its potential height growth? J Biogeogr 35:1851–1862
Solomon DS, Hosmer RA, Hayslett HT Jr (1986) A two-stage matrix model for predicting growth of forest stands in the Northeast. Can J For Res 16:521–528
Sterba H, Golser M, Moser M, Schadauer K (2000) A timber harvesting model for Austria. Comput Electron Agric 28:133–149
Thürig E, Schelhaas MJ (2006) Evaluation of a large-scale forest scenario model in heterogeneous forests: a case study for Switzerland. Can J For Res 36:671–683
Tomppo E, Gschwantner T, Lawrence M, McRoberts RE (2010) National forest inventories—pathways for common reporting. Springer, Heidelberg
UNECE, United Nations Economic Commission for Europe (2005) European forest sector outlook study, main report. United Nations, Geneva
Vanclay JK (1994) Modelling forest growth and yield. Applications to mixed tropical forests. CAB International, Wallingford
Wernsdörfer H, Rossi V, Cornu G, Oddou-Muratorio S, Gourlet-Fleury S (2008) Impact of uncertainty in tree mortality on the predictions of a tropical forest dynamics model. Ecol Model 218:290–306
Acknowledgements
We are particularly grateful to Nicolas Picard, Sylvie Gourlet-Fleury, Frédéric Mortier and Dakis-Yaoba Ouédraogo at the French CIRAD (Centre de Coopération Internationale en Recherche Agronomique pour le Développement) for valuable discussions on forest dynamics modelling. Moreover, we thank two reviewers for constructive and helpful comments on an earlier manuscript.
Funding
Funding was provided by the French General Directorate for Education and Research DGER (Direction Générale de l'Enseignement et de la Recherche).
Author information
Authors and Affiliations
Corresponding author
Additional information
Handling Editor: Matthias Dobbertin
Contribution of the co-authors
H.W. coordinated the presented work on the model, performed the model sensitivity analysis, and wrote the manuscript; A.C. and H.C. calibrated the model and ran the simulations, provided expertise on the model, and contributed to manuscript writing; J.-D.B. contributed to the set-up and performance of the scientific work on the model (scope and positioning, conceptual design), brought up structuring ideas in view of further model development, and contributed to manuscript writing; G.P. provided expertise on the model, wrote an NFI intern technical model description including approaches to further model development; S.C. brought up a thematic context that lead to the initiation of the work on the model; J.-M.L. contributed to the scientific positioning of the work on the model; J.-C. H. contributed to orientation and structure of work on the model, and provided expertise on the model; M.F. initiated the work on the model and contributed to its scientific positioning, and promoted the research project including funding.
Appendices
Appendix 1: Methods used to calculate model parameter values
1.1 Growth parameter (g s,i)
We calculated g s,i-values (1 / year) specifically for each stratum (s) and diameter class (i, where i < k) as
with
and
where ∆d s,i,y = mean annual diameter increment (cm / year, over bark) of the trees inventoried in year y; w s,i = diameter class width (cm, over bark); n s,i,y = number of trees inventoried in year y; \( \frac{{\Delta r{c_{{s,i,j,y}}}}}{5} \)= mean annual radial increment (cm / year, over bark) over the 5-year period prior to the inventory year of tree j inventoried in year y; ∆rc s,i,j,y-values were measured on increment cores (under bark) as the cumulated width of five annual rings, and an estimate of bark thickness increment was added, based on NFI bark thickness equations (C. Duprez and F. Morneau 2010, French NFI, unpublished data); inventory years (y) consisted of 2006, 2007 and 2008.
This calculation method meant that annual radial increments in some years were more represented than those in other years because the 5-year increment periods partly overlapped. However, different trees were inventoried in each of the years in 2006–2008 (see French National Forest Inventory method), and our aim was to obtain robust parameter values representing mean growth over several years.
If for a given stratum diameter class n s,i,y = 0 for y = 2006–2008, we calculated its g s,i-value through interpolation based on the two g s,i-values of the next lower and next higher diameter classes.
1.2 Felling + mortality parameter (fm s,i)
We calculated stratum (s) and diameter class (i)-specific fm s,i-values (1 / year) as
where nfm s,i,y = number of trees that disappeared (due to felling or mortality) from the stratum diameter class (s,i) over the 5-year period prior to the inventory year y; nfm s,i,y-values were assessed based on the decomposition status of tree stumps and dead trees; and cf = global correction factor to tune fm s,i-values in such a manner to approximately meet the total stem volume that disappeared in 2007 on the country scale (FAO 2010; MAAPRAT 2011). If n s,i,y = 0 for y = 2006–2008, then fm s,i = 0.
1.3 Recruitment parameter (r s,1)
We calculated stratum (s)-specific r s,1-values (number of trees / year) as
where
and n s,y = number of trees inventoried in year y; d s,j,y = diameter (cm, over bark) of tree j inventoried in year y; ∆rc s,j,y = radial increment (cm, over bark) over the 5-year period prior to the inventory year of tree j inventoried in year y; ∆rc s,j,y-values were measured on increment cores (under bark) as the cumulated width of 5 annual rings, and an estimate of bark thickness increment was added, based on NFI bark thickness equations (C. Duprez and F. Morneau 2010, French NFI, unpublished data).
Appendix 2: Method used to calculate sensitivity measurements
We calculated sensitivity measurements separately per diameter class for a given model parameter or output variable Y. The sensitivity of Y to one model input factor (here: stratification factor) X a (first order effect) was measured as the ratio between the Y-variance V a, due to X a, and the total Y-variance V(Y) (Saltelli et al. 2004; Wernsdörfer et al. 2008):
Similarly, the sensitivity of Y to two input factors X a, X b (second order effect) and three input factors X a, X b, X c (third order effect) was measured as
where V a,b and V a,b,c are the Y-variances due to X a, X b and X a, X b, X c, respectively. The variances V a, V a,b and V a,b,c were calculated as
where the expectation E was approximated as a mean. For a deterministic model, the sum of the sensitivity measurements for all orders is equal to one.
In this study, V(Y) was the empirical variance across the 54 values of Y, i.e. across the 54 strata subjected to the global sensitivity analysis (see Global sensitivity analysis). Considering the 54 values of Y as the outcome of a three-factor pseudo-experiment without replicates, the decomposition of the variance of Y was basically the same as for a three-way analysis of variance (though here unbalanced). As there was no replicate, the number of degrees of freedom for the residuals was equal to zero. However, the residual variation may be identified using the third order interaction. This means that the first-order effects and the second-order interactions could be interpreted as a ratio over the third-order interaction.
Rights and permissions
About this article
Cite this article
Wernsdörfer, H., Colin, A., Bontemps, JD. et al. Large-scale dynamics of a heterogeneous forest resource are driven jointly by geographically varying growth conditions, tree species composition and stand structure. Annals of Forest Science 69, 829–844 (2012). https://doi.org/10.1007/s13595-012-0196-1
Received:
Accepted:
Published:
Issue Date:
DOI: https://doi.org/10.1007/s13595-012-0196-1