Thematic Issue
- Original Paper
- Published:
Estimating uncertainty of allometric biomass equations with incomplete fit error information using a pseudo-data approach: methods
Annals of Forest Science volume 72, pages 825–834 (2015)
Abstract
Key message
Knowing the uncertainty for biomass equations is critical for their use and error propagation of biomass estimates. Presented here is a method to estimate uncertainty for equations where only n and R 2 values from the original equations are available.
Context
Tree allometric equations form the basis of research and assessments of forest biomass. Frequently, uncertainty estimations do not propagate errors from these equations since the necessary information about sampling and tree measurements is not included in the original publication. Many biomass studies were conducted decades ago and the original, raw data is unavailable.
Aims
Because of this information deficiency, and to improve error estimates in applications, a system to estimate the error structures of such equations is presented.
Methods
A pseudo-data approach involving the creation of possible (pseudo) data using only R 2 and n with a simple Monte-Carlo process generates probable error structures that can be used to propagate errors.
Results
In a test of five different species with varying n input data and population variability, the original error structures were successfully recreated.
Conclusion
This method of creating pseudo-data is simple and extensible and requires commonly published information about the original dataset. The method can be employed to create new ecosystem-level equations from species-specific equations, implemented in systems to select allometric equations to reduce uncertainty, and aid in the design of large-scale campaigns to generate new allometric equations for improving local to national scale estimates of forest biomass. The R code will be made freely available to anyone upon request to the authors.
1 Introduction
1.1 Global importance of tree allometric equations
Biomass estimates for large forested regions are important to our understanding of the global carbon cycle and climate, and there are several emerging reasons to predict as accurately as possible the amount of carbon stored in forested ecosystems and exchanged with the atmosphere (IPCC 2013). There is increasing recognition that changes in the land surface may significantly affect climate, and earth system modeling studies have revealed the importance of accurately representing changes in terrestrial biomass to improve global climate projections which currently focus mainly on emissions from wildfire from land use change (Oleson et al. 2010; Shevliakova et al. 2009). Biomass estimates and quantification of uncertainties are also critical for mitigation strategies, because carbon markets and other mechanisms for reducing atmospheric CO2 concentrations through forestry require monitoring and reporting systems including quantification of the uncertainty associated with these estimates (Birdsey et al. 2013). Beyond the realm of climate, global demands for energy increasingly consider use of biomass for fuel to be a cost-effective alternative to fossil fuels in some areas (US Department of Energy 2011). Current and prospective users of biomass energy require accurate estimates of biomass supply to support their operations or strategic siting of facilities.
Studies in the USA have shown that the selection of biomass equations for regional studies may make a significant difference in the resulting biomass estimates, with differences ranging up to 30 % (Domke et al. 2012). However, lack of quantitative error estimates for the selected equations hinders ability to make a selection appropriate to the intended use. Often, generalized biomass equations are used when local equations are lacking, but these rarely include assessment of uncertainty and guidance for appropriate application (Jenkins et al. 2003; Chave et al. 2005).
1.2 Importance of understanding allometric equation uncertainty
Estimation error is important to understand across all scales, especially when the sample number is low. Propagated uncertainty estimates that account for allometric equation error facilitate comparisons with other components of the total error in a system. For example, it is useful to know if allometric equation error is small compared to sampling error when reporting biomass stocks from large inventories and over large areas (Johnson et al. 2014). Additionally, tree-level error propagation is even more important when estimates and their uncertainties are required for decisions based on inventories of small areas (e.g., a community-managed forest) or for a pixel-level validation of biomass maps with individual plots. Most allometrics generated for forest areas having smaller size classes with few large trees show a greater variance in biomass per diameter at breast height (DBH), i.e., heteroscedasticity, and may introduce large biases in biomass estimates. Propagating errors for biomass estimates using tree allometric equations from published literature requires detailed fit information (fit parameters’ confidence intervals, sum of square errors (SSEs), R 2, n, etc.) from the original published work.
1.3 Pseudo-data approach to tree allometric model uncertainty estimation
The uncertainty of predicted values cannot be propagated from incomplete allometric model fit statistics. Often, researchers today rely on allometric models published decades ago where little information beyond the number of trees harvested and the R 2 of the model fit were included. To overcome this limitation, pseudo-data that mimic underlying sample populations can be generated using limited fit information, providing insight into the variance of the data used to create the original allometric model. This pseudo-data can then be used to estimate the uncertainty for the original allometric model. The result is not a perfect recreation of the model fit statistics, but it allows a better understanding of the error structures for the original allometric model and error propagation. It must be made clear that the technique described in this research is to be used only when all other options for recovering the proper fit statistics are exhausted. The original, raw data should be sought out, but after many decades, much of that data has been lost.
Pseudo-data have been used widely for a variety of purposes. It is most often used in meta-analysis studies to combine information from a variety of sources where the models cannot be mathematically combined due to different forms and parameters (Bowden et al. 2006; Blunden et al. 2010), improving model estimations (Ooi and Chetty 2005) and in simulations (Wood et al. 1994; Rigby et al. 2012).
For tree allometric models the R 2 of the fit, n, and range of n information are generally available. The R 2 of the fit provides information about the residuals of the fit with respect to the published model. Using this basic statistic, pseudo-populations can be generated that mimic the original data and then be used to generate estimates of model uncertainty, most notably error bounds for the model’s parameters that are used to propagate model error. It is important to note that in creating tree allometric equations using non-linear methods, the R 2 is a less reliable statistic than others; however, in many cases, it is the only statistic published to indicate quality of the resulting model.
The aim here is to present detailed methods for the creation of pseudo-data in the context of tree allometry using a Monte-Carlo technique, compare the pseudo-data method against model fits using raw, destructive harvest data and provide specific recommendations for the application of this method.
2 Methods
2.1 Pseudo-data generation for allometric equations
In general, the process of pseudo-data generation, selection, and uncertainty estimation for allometric equations where only the R 2 and n are known is shown in Fig. 1. To create a pseudo-dataset of points from which the allometric equation could have been generated, several steps are required:

Pseudo-data generation process flow chart highlighting the steps involved in the process
-
1.
A large number (10,000 in this case) of DBH values within the DBH range of the original allometric equation are generated from a uniform distribution. These DBH values are then used to calculate biomass values from the original equation. Generating DBH values from a uniform distribution allows for later selection of n-sized subsets using different distributions for subset selection described in step 4. At the end of this step, according to our example, there are 10,000 DBH values distributed evenly over the range of diameters from the harvested trees and their calculated biomass values.
-
2.
Biomass values generated in step 1 are then randomly “fuzzed” by small, random steps drawn from a normal distribution multiplied by the original biomass to create a pseudo-population with varying biomass as a function of DBH. If the original equation is linear or log-transformed to use a linear fitting process, no further random dispersion is introduced. If the original equation is non-linear and was fit using a non-linear routine, heteroscedasticity is introduced using a dispersion function based on DBH. Since the variability in the biomass of trees grows larger as the diameter increases (i.e., it is heteroscedastic) the process must present a wider range of biomass values as the diameter increases. The function to introduce this effect here is very simple and generic. If the user has information of this relationship from other data, species, etc., they should use that instead. Figure 2 shows what hypothetical pseudo-data might look like with different R 2 values and heteroscedasticity. Note how the variance in biomass increases as the DBH increases in both cases, but also the overall dispersion of the data is less with the higher R 2 value. The dispersion increments should depend on the precision with which the original R 2 was reported; smaller increments should be used with a higher precision R 2 reported (e.g., four or five decimal places). Usually, 1000 pseudo biomass sets are sufficient, ranging from very low to high variance. At the end of this step, the user will have 1000 (or more) pseudo-datasets, each containing 10,000 (or more) DBH biomass points plus the original set of 10,000 points calculated from the original equation.
Fig. 2 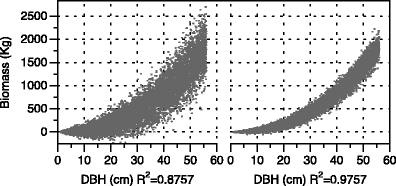
Example of pseudo-data dispersion with lower (left) and higher (right) R 2 values used in the pseudo-data generation process
-
3.
For each of the sets of pseudo-data, the R 2 is calculated using the starting DBH and biomass values (from step 1). To avoid fitting a curve to each of the 1000 new datasets from step 2, the coefficient of determination can be defined as follows:
$$ {R}^2\equiv 1-\frac{{\mathrm{SS}}_{\mathrm{residuals}}}{{\mathrm{SS}}_{\mathrm{total}}} $$(1)where
$$ {\mathrm{SS}}_{\mathrm{residuals}}={\displaystyle \sum_i{\left({\mathrm{biomass}}_{{\mathrm{pseudo}}_i}-{\mathrm{biomass}}_{{\mathrm{orig}}_i}\right)}^2} $$(2)and:
$$ {\mathrm{SS}}_{\mathrm{total}}={\displaystyle \sum_i{\left({\mathrm{biomass}}_{{\mathrm{pseudo}}_i}-\overline{{\mathrm{biomass}}_{\mathrm{pseudo}}}\right)}^2} $$(3)The logic here may seem reversed, but the pseudo-data are considered our observed data and the original biomass is the predicted value. The pseudo-dataset with the R 2 most closely matching the published R 2 is then selected. This step results in one final pseudo-dataset that may look like one of those shown in Fig. 2. This is the dataset used in the following steps.
-
4.
From the chosen pseudo population in step 3, a subsample of n data points is drawn, where n is the number of trees harvested in the original experiment that is being recreated. Here, a truncated Weibull distribution (Weibull 1951a, b) without replacement, was used 10,000 times. The truncated Weibull distribution was selected since most tree allometric equations are created using destructive harvests where more trees are cut toward the lower end of the diameter range than the larger end for reasons of practicality. If the original DBH distribution can be inferred from the original manuscript, e.g., “trees were chosen uniformly across the DBH range,” then that should be used instead of what is presented here. The result of this step is 10,000 sets of DBH and biomasses each containing n values.
-
5.
Each subset from the pseudo-populations from step 4 is then fit using the original equation form, and all fit parameters and error statistics are saved. This step requires a model fitting routine that can be automated as repeating a curve fit procedure 10,000 times individually would be very onerous.
-
6.
SE, R 2, adjusted R 2, root mean square error (RMSE), and model parameters are calculated as the mean of the 10,000 trials. Standard deviations are also calculated for examination of simulation dispersion. The number of trials follows good practice guidance (IPCC 2006) when using Monte-Carlo simulations for uncertainty estimations. However, usually ∼100 simulations are sufficient to converge on the estimate of uncertainty. The distributions of the resulting means and parameters are checked for normality as a quality control step.

Steps 1 through 3 can be vectorized in the computer code, and the creation of the pseudo-populations is nearly instantaneous. Steps 4 though 6 generally require the use of programmatic loops for the calculations, but can be processed using parallel computing code to increase overall speed.
2.2 Validation
2.2.1 Experimental data
Raw destructive harvest data for DBH and biomass were obtained from the ENergy from the FORest research program (ENFOR) of the Canadian Forest Service (Ung et al. 2005, 2008). Five species from this dataset were selected based on n, DBH range, and distribution (Table 1).
2.2.2 Validation process
As a validation exercise, the biomass and standard errors of the generated allometric equations from the raw, known data and the pseudo-data approach were compared for five selected species from the ENFOR dataset.
To create the “original” allometric equation, DBH and biomass data for each species from the dataset were fit to the equation:
with the biomass in kilograms and the DBH in centimeters. The non-linear regression was solved iteratively by the Gauss-Newton method, and the parameters and fit statistics were calculated using MATLAB R2013b (MathWorks 2013).
The pseudo-data generation process outlined above was implemented using MATLAB for each species using only input information from the original fit of R 2 and n. Since the original equation is the result of a non-linear fit, the creation of the “fuzzed” biomass sets of pseudo-data was of the following form:
where s var is a scaling factor that increments from 1 to 200 by step 0.2 and r norm is a random number drawn from a normal distribution, mean 0, variance 1. This equation, at lower DBH values, can produce illogical negative numbers, but these were not removed from the pseudo-data.
The selected pseudo-data population for each species was then re-fit to each subsample from the Weibull distribution 10,000 times, and the fit information was summarized. The Weibull distribution was chosen following the assumption that, against best practice guidelines, more, smaller trees would have been chosen for allometric model generation. The shape of the distribution was given generic values from the researchers’ experience and scaled to the DBH range. The standard errors of the model curves were generated using JMP v.9 software (SAS 2007) and distribution of biomass each pseudo-data trial (subsample) and ENFOR datasets were compared by creating cumulative distribution functions and calculating Kolmogorov-Smirnov (KS) statistics. The KS statistic is a metric of the maximum distance between two cumulative distribution functions (CDF), where higher values reflect poorer agreement (Riemann et al. 2010).
3 Results
Biomass versus DBH (Fig. 3) plotted by species for both datasets with the original model and harvested data for each species shows that the pseudo-data approach encompasses the range of input data well. The model fit summary for the subsampled pseudo-data is not included for clarity. While the DBH and biomass relationship is useful, it is the underlying structure of the error of the model fit that is most important. As seen in Fig. 4, the underlying error structure does vary by DBH as expected, with higher error generally at higher DBH in both the original fitted model and in the pseudo-data. The relationship between the original model and the pseudo-data errors varies by species and with n. However, the relative error as a function of biomass is greater at lower DBH values for all species (not shown).

Biomass versus DBH for each species showing the fitted model (dashed line), the overall range of pseudo-data (background), and the raw, harvested data for comparison

Standard error curves of the original model (dashed line) and pseudo-data trials (background)
While visual inspection is useful to understand the trends, Table 2 shows the comparison between the original model and the summary of the 10,000 pseudo-data trials. In terms of the model parameters, the pseudo-data process produced nearly identical estimates to the original model. The 95 % confidence intervals of those parameters show a wider range for the pseudo-data except in the case of black cottonwood. Black cottonwood estimates for SSE and RMSE are lower than those of the original model, and elsewhere, the SSEs and RMSEs between the original model and the pseudo-data are similar. R 2 and adjusted R 2 are nearly identical except in the case of red maple where it is higher, which is unexpected. Overall, estimating the original model errors from using only R 2 and n as inputs into the pseudo-data process seems valid.
The KS summary (Table 3) shows that as n decreases, the agreement between the CDFs tends to decrease (i.e., increasing KS), indicating that biomass distributions are more difficult to replicate with the pseudo-data approach when sample sizes are small.
4 Discussion
4.1 Validation experiment
For three of the five species tested (black spruce, aspen, and red spruce), creating pseudo-data from just R 2 and n result in error structures, goodness of fit statistics, and parameter values that are indistinguishable from the original model fit information. Not coincidentally, the KS statistics for these species are the lowest of the five species examined here. The pseudo-data creation process for red maple and black cottonwood produce parameter estimates equal to those for the original model fit; however, the goodness of fit statistics are different from the original equation. These differences are also reflected in the confidence intervals around the β0 and β1 model parameters where in an error propagation exercise, the pseudo-data results overestimate uncertainty for red maple and underestimate uncertainty for black cottonwood.
For these two species, the differences in uncertainty from the original model could be due to two main processes or a combination of each. The biomass and DBH distributions of the harvested data for red maple and black cottonwood are shown in Figs. 5 and 6, respectively. For red maple, the pseudo-data contain a proportionally larger number of diameters on the lower end than the raw data, especially below 20 cm DBH. In Fig. 4, red maple, from 20 to 36 cm, the error of the pseudo-data model is consistently higher than the original model. Due to the relatively larger numbers of data points in this range, the overall parameter confidence intervals are affected. Also, the lower errors estimated from the pseudo-data at higher DBH than the original data suggest that red maple as a species is more variable at higher DBH (i.e., more heteroscedastic) and the function chosen to recreate this for pseudo-data generation did not introduce enough variance at higher DBH.

Red maple biomass and DBH distributions for the raw and pseudo-data for comparison

Black cottonwood biomass and DBH distributions for the raw and pseudo-data for comparison
Black cottonwood (Figs. 6 and 4) shows the opposite trend, with the pseudo-data model error, on average, higher with a wider range. Either the general Weibull distribution is sampling the overall pseudo-data in a non-optimal sense to match the original data, the model form on which the original equation is based is not appropriate for the input data, or, more likely, a mix of both. This result, while not optimal, does not invalidate the approach. The original data are known here, but in a real-world case, none of this comparative information would be available. Improper model choice by the original researcher cannot be addressed by this technique, but altering the sample distribution for the Monte-Carlo subsampling can be examined. Figure 7 shows the comparison of errors from pseudo-data against the original model where a uniform sample distribution was used. The pseudo-data, on average, tend to overestimate the error across all DBH values, but the shape more closely fits that of the original error structure. However, the improvement is slight.

Black cottonwood standard error of the original model (dashed line) and pseudo-data trials (background) where trials were drawn from a uniform distribution
4.2 Recommendations for pseudo-data use with tree allometric models
4.2.1 Heteroscedasticity function: fuzzy wuzzy… but how fuzzy?
The function presented in the validation exercise to randomize the biomass data and introduce heteroscedasticity is not based on any ecological premise. It is a simple step scalar with a random component, and yet, the generation of the pseudo-population performed reasonably well. If nothing is known about the relation between DBH and biomass and the variance of the target species of the allometric model, a simple assumption as used here is sufficient. While not required, if this information can be determined or inferred from other sources, it will improve the overall results as would be the case for red maple.
In selecting a function to randomize the biomass data, the user should take care to not introduce unreasonable variance into the process as; at times, 1000 pseudo-populations would not be enough to produce a pseudo-dataset with an R 2 close to the target (published) R 2. When implementing this system, the differences in published R 2 and selected pseudo-data R 2 should be examined to ensure the process results in a credible pseudo-population.
The step interval incorporated into the biomass randomization process should also be small enough to create subtle differences in each pseudo-population so that the difference in published and pseudo R 2 is as small as possible. In general, this difference should be on the order of 0.0005 or less for an R 2 reported to four significant figures. If this is not the case, modifying the randomization routine to generate more subtly different pseudo-populations is recommended.
4.2.2 Subsample distribution: to Weibull or not to Weibull?
When subsampling the pseudo-population to estimate parameter errors, the choice of distribution is important. Any external data or inference about the sample distribution used to create the original allometric model should be used. In the validation exercise here, a general, truncated Weibull distribution was used as most allometric model generation work involves selecting trees for harvest that fit this distribution. It is important to remember that the choice of distribution should match the harvested data distribution. This is not to be confused with the diameter distribution of the target population. Tree allometric equations are designed to describe the relationship between some easily measured characteristic of a tree (e.g., DBH height) and some useful metric (e.g., biomass and volume) that cannot be directly measured in the population of interest.
4.2.3 What pseudo-data cannot do
The method presented has its limitations. The uncertainty information produced is only an estimate derived from the original model error. Thus, it should not be used to generate new allometric models of different form, as the pseudo-population is just a large dataset that should contain a reasonable representation of the original data. Effectively, there exist an infinite set of combinations of input data that could have produced the published R 2. Other uncertainty due to the tree allometric model such as bias from model form, input data selection (e.g., range, distribution, and n), and fitting method are not explicitly included in estimates produced using this method.
5 Conclusions
Creating pseudo-populations that mimic the range of possible DBH versus biomass relationships based on very little information (R 2 and n) is possible. Therefore, the uncertainty can be propagated using this information for older equations so that individual allometric equation errors can be aggregated at the plot level and added to sampling errors, and then be included in local- to regional-scale estimates (e.g., Johnson et al. 2014). The uncertainty estimated by this method is most likely an overestimate depending on the forest DBH distributions and error propagation technique used.
The method presented here is simple and extensible and requires little information about the original dataset. It can easily be adapted for use with models that have multiple independent variables simply by using multidimensional arrays. Implementation is straightforward, and the use of a Monte-Carlo method is easy to understand. The code will be made available online at both the Quantifying Uncertainty in Ecosystem Studies (http://www.esf.edu/quest) and Globallometree (http://www.globallometree.org) websites.
While these methods are useful for estimating uncertainty, they do not replace well-designed, large-scale field campaigns for generating allometric equations using a standardized approach. Field campaigns are critical for reducing errors associated with allometric equation development so that the principle source of uncertainty is from natural variability.
Biomass estimates for large forested regions are important to our understanding of the global carbon cycle, especially now that there is a need to predict as accurately as possible carbon stored in forested ecosystems to improve global models of CO2 for climate change. Also, national greenhouse inventories, mitigation strategies, carbon markets, and other mechanisms require knowledge about the uncertainty associated with these estimates at national, regional, and smaller scales. Uncertainty estimates are required to be associated with these values. In order to use existing allometric equations, a method like this is a valuable tool for these efforts.
In the future, aggregate allometric equations for functional groups (e.g., Jenkins et al. 2003; Woodall et al. 2011) can have robust uncertainty estimations useful for propagating errors associated with them. A slight modification to this process would also allow for minimizing errors of functional groups’ allometric equations. Through Monte-Carlo experiments, the groupings can be changed and the effects on uncertainty can be examined. Uncertainty can be minimized a priori to select a level of uncertainty to meet and functional groups can be created.
References
Birdsey RA, Angeles-Perez G, Kurz WA, Lister A, Olguin M, Pan YD, Wayson C, Wilson B, Johnson K (2013) Approaches to monitoring changes in carbon stocks for REDD. Carbon Manag 4:519–537
Blunden S, Olds T, Petkov J, Forchino F (2010) The relationships between sex, age, geography and time in bed in adolescents A meta-analysis of data from 23 countries. Sleep Med Rev 14:371–378. doi:10.1016/j.smrv.2009.12.002
Bowden J, Thompson JR, Burton P (2006) Using pseudo-data to correct for publication bias in meta-analysis. Stat Med 25:3798–3813. doi:10.1002/sim.2487
Chave J, Andalo C, Brown S, Cairns MA, Chambers JQ, Eamus D, Folster H, Fromard F, Higuchi N, Kira T, Lescure JP, Nelson BW, Ogawa H, Puig H, Riera B, Yamakura T (2005) Tree allometry and improved estimation of carbon stocks and balance in tropical forests. Oecologia 145:87–99
Domke GM, Woodall CW, Smith JE, Westfall JA, McRoberts RE (2012) Consequences of alternative tree-level biomass estimation procedures on U.S. forest carbon stock estimates. Forest Ecol Manag 270:108–116
IPCC (2006) IPCC guidelines for national greenhouse gas inventories; Volume 4 Agriculture, forestry and other land uses. IGES, Japan
IPCC (2013) Climate change 2013: the physical science basis. Contribution of Working Group I to the Fifth Assessment Report of the Intergovernmental Panel on Climate Change [Stocker TF, D Qin, G-K Plattner, M Tignor, SK Allen, J Boschung, A Nauels, Y Xia, V Bex and PM Midgley (eds)]. Cambridge University Press, Cambridge, UK and New York, NY, USA, p 1535
Jenkins JC, Chojnacky DC, Heath LS, Birdsey RA (2003) National-scale biomass estimators for United States tree species. For Sci 49:12–35
Johnson KD, Birdsey RA, Finley AO, Swantaran A, Dubayah R, Wayson CA, Riemann R (2014) Integrating forest inventory and analysis data into a LIDAR-based carbon monitoring system. Carbon Balance Manag 9:3
MATLAB, Statistics Toolbox and Curve Fitting Toolbox Release 2013b, The MathWorks, Inc., Natick, MA, USA
Oleson KW, Lawrence DM, Gordon GB, Flanner MG, Kluzek E, Lawrence PJ et al (2010) Technical description of version 4.0 of the Community Land Model (CLM). NCAR Technical Note NCAR/TN-478 + STR. National Center for Atmospheric Research, Boulder
Ooi CH, Chetty M (2005) Increasing classification accuracy by combining adaptive sampling and convex pseudo-data. Lect Notes Artif Int 3518:578–587
Riemann R, Wilson BT, Lister A, Parks S (2010) An effective assessment protocol for continuous geospatial datasets of forest characteristics using USFS Forest Inventory and Analysis (FIA) data. Remote Sens Environ 114:2337–2352
Rigby M, Manning AJ, Prinn RG (2012) The value of high-frequency, high-precision methane isotopologue measurements for source and sink estimation. J Geophys Res Atmos. doi:10.1029/2011jd017384
SAS Institute Inc: JMP, Version 9. Cary, NC (2007)
Shevliakova E, Pacala SW, Malyshev S, Hurtt GC, Milly PCD, Caspersen JP, Sentman LT, Fisk JP, Wirth C, Crevoisier C (2009) Carbon cycling under 300 years of land use change: Importance of the secondary vegetation sink. Glob Biogeochem Cycles 23:GB2022
Ung CH, Lambert MC, Raulier F (2005) Canadian national tree aboveground biomass equations. Can J For Res 35:1996–2018. doi:10.1139/X05-112
Ung CH, Bernier P, Guo XJ (2008) Canadian national biomass equations: new parameter estimates that include British Columbia data. Can J For Res 38:1123–1132. doi:10.1139/X07-224
U.S. Department of Energy (2011) U.S. billion-ton update: biomass supply for a bioenergy and bioproducts industry. R.D. Perlack and B.J. Stokes (Leads), ORNL/TM-2011/224. Oak Ridge National Laboratory, Oak Ridge, TN. 227p
Weibull M (1951a) The regression problem involving non-random variates in the case of stratified sample from normal parent populations with varying regression coefficients. Skand Aktuarietidskr 34:53–71
Weibull W (1951b) A statistical distribution function of wide applicability. J Appl Mech-Trans ASME 18:293–297
Wood LL, Miedema AK, Cates SC (1994) Modeling the technical and economic-potential of thermal-energy storage-systems using pseudo-data analysis. Resour Energy Econ 16:123–145. doi:10.1016/0928-7655(94)90002-7
Woodall CW, Heath LS, Domke GM, Nichols MC (2011) Methods and equations for estimating aboveground volume, biomass, and carbon for trees in the U.S. forest inventory, 2010. Gen. Tech. Rep. NRS-88. U.S. Department of Agriculture, Forest Service, Northern Research Station, Newtown Square. 30 p
Acknowledgments
The R, Matlab, or Python code will be made freely available to anyone upon request to the corresponding author and will gladly answer any questions or provide assistance if requested. We thank Chhun-Huor Ung for facilitating use of Canada’s Energy from the Forest program data (ENFOR) that was valuable for comparing our simulations of standard errors. The research was supported in part by a grant from the National Aeronautical and Space Agency (NNH08AH971) and by the US Forest Service.
Author information
Authors and Affiliations
Corresponding author
Additional information
Handling Editor: Laurent Saint-Andre
Contribution of the co-authors
Kris D. Johnson: Involved extensively in the generation of the theory and process described here as well as multiple reviews and general outline of the manuscript
Jason A. Cole: Designed and developed the software to process the data in python for implementation on a larger scale
Marcela I. Olguín: Involved extensively in the generation of the theory and process described here as well as multiple reviews and general outline of the manuscript
Oswaldo I. Carillo: Statistical support and validation analysis
Richard A. Birdsey: Drafting of general background text, overall scientific design guidance
Rights and permissions
About this article

Cite this article
Wayson, C.A., Johnson, K.D., Cole, J.A. et al. Estimating uncertainty of allometric biomass equations with incomplete fit error information using a pseudo-data approach: methods. Annals of Forest Science 72, 825–834 (2015). https://doi.org/10.1007/s13595-014-0436-7
Received:
Accepted:
Published:
Issue Date:
DOI: https://doi.org/10.1007/s13595-014-0436-7